Computing
How to plot a database of points using ArcGIS on the PWF
Introduction
This document describes how to FIXME. You can always obtain the latest version of this document from: http://www.arch.cam.ac.uk/comp/FIXME/
This document describes how to plot a database of points, for example a list of archaeological sites with names and locations, using ArcGIS on the PWF.
For a relatively simple data set, the easiest way to proceed is to construct a list of sites or points in so-called CSV (Comma Separated Values) format. Consider the following sites:
| Place | Longitude | Latitude |
|---|---|---|
| Xaghra | 14.2667 E | 36.0500 N |
| Troina | 14.6167 E | 37.7833 N |
| Nepi | 12.3500 E | 42.2333 N |
| Gubbio | 12.5833 E | 43.3500 N |
Because E (East) and N (North) are positive (West and South would be negative), we can discard that information and create an Excel spreadsheet that looks like this:
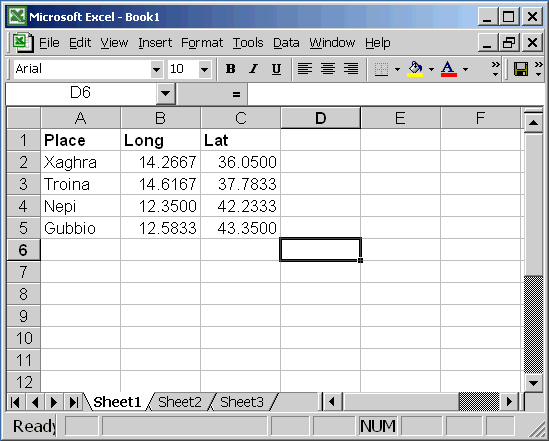
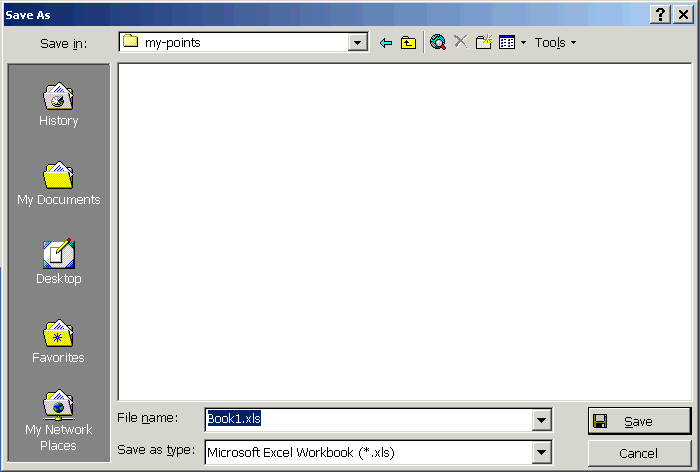
You must be circumspect when choosing the column titles. Some words are so-called reserved words and ArcGIS will be unhappy should you try to use them. (No, I haven’t managed to find a list of these reserved words, although I’m sure I once saw one). Do not use punctuation, spaces, non-ASCII characters in the column headings. ArcGIS will choke on these but won’t bother to explicitly tell you that it doesn’t like them. In other words, `x’ is a good column heading for the x co-ordinates. `grid x’ is not. `Place’ is a good heading for the column of site names. `Site name’ is not. Anyway, enough of this carefree banter. Go to the File menu in Excel and choose Save As. You will see the Save As dialogue box:
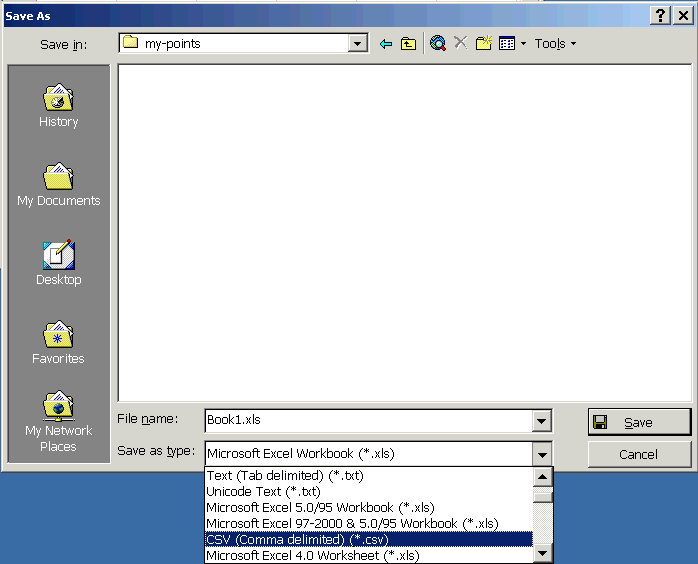
Set Save as type: to CSV:
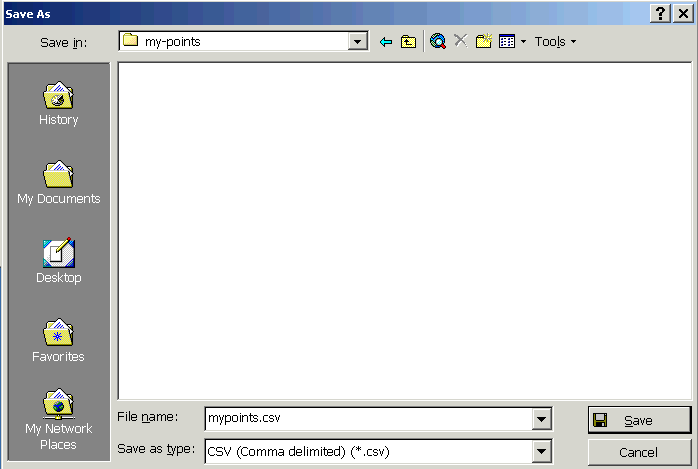
Choose somewhere sensible, and select a sensible filename. ArcGIS will choke on various characters in the file name so use only the letters A-Z and numbers 0-9—no spaces, punctuation, or other rubbish:
When you click the Save button Excel will ask you a series of stupid questions. Say OK, pausing only to note that if your spreadsheet contains multiple workbooks you will need to export each one individually:

Another stupid question. Say Yes:

When you try to close Excel, even if you haven’t made any changes since doing the Save As bizzo described above, you may see the message below. Assuming you haven’t made any changes, say No:

Find the CSV file that you have just created:
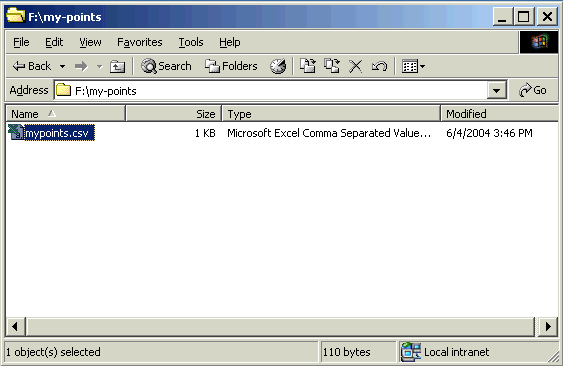
Right-click on it and choose Open With:
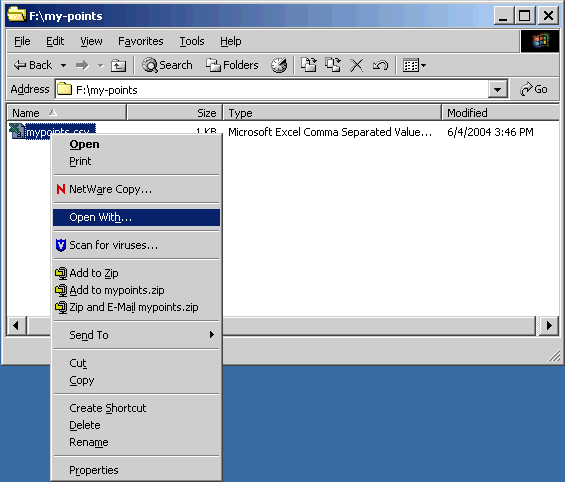
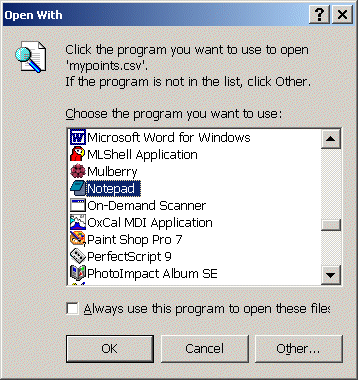
Choose Notepad:
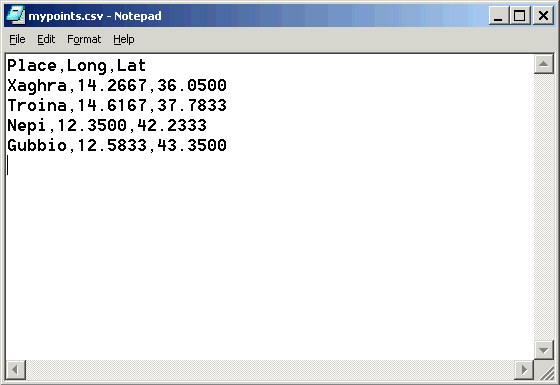
This is what a CSV file looks like. You can see that each piece of information is separated from the next by a comma. It should be obvious to you that:
- These files are extremely easy to create by simply typing directly into Notepad if you don’t want to muck around with Excel
- Including commas in your data set (other than as delimiters) is going to make everybody very unhappy.
On occasion, ArcGIS chokes when trying to import a CSV file that contains a trailing blank line, so it is a good idea, if you create your CSV file using Excel, to subsequently open the CSV file in Notepad, scroll right to the end of it and delete any blank lines.
OK. You should now be the proud possessor of a a CSV file, either by creating one using the information above, or because you have created one containing data that is of interest to you. Start ArcMap by clicking on the Start button in the bottom left hand corner of the screen:

Choose PWF Programs:

Choose Database Packages:

Choose ArcGIS:

Choose ArcMap:

ArcMap starts up:

Go to the Tools menu and choose Add XY Data:
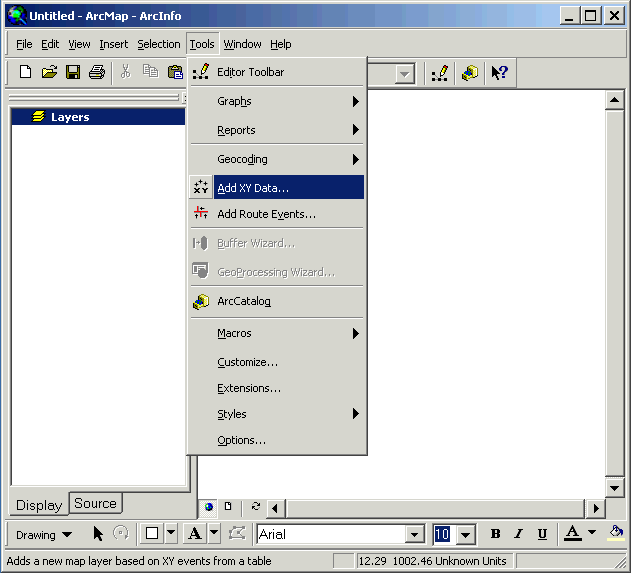
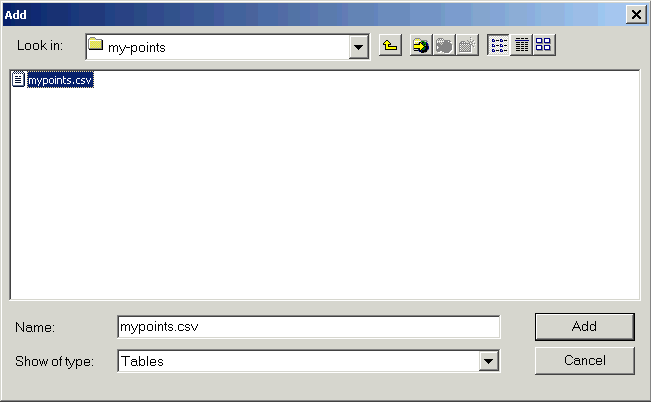
Browse and find your CSV file, then click the Add button:
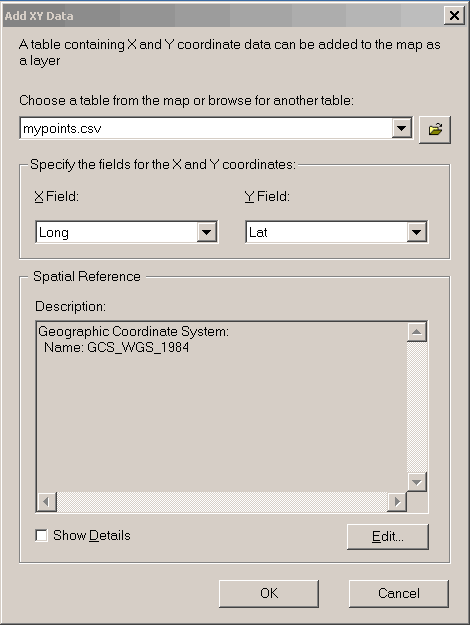
If you have named two columns Lat and Long, or X and Y, ArcMap will automagically identify them as containing co-ordinates:
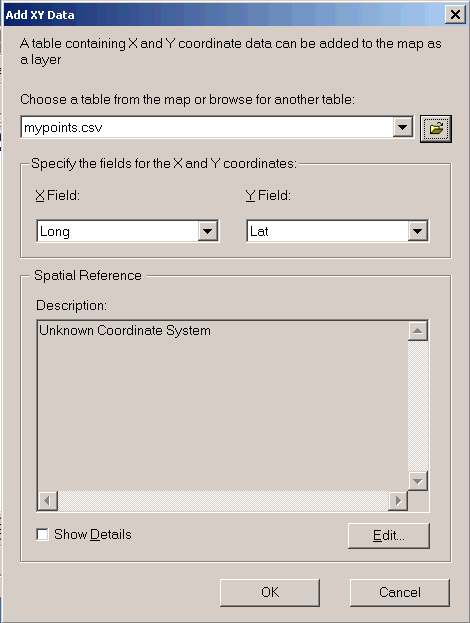
Click the Edit button to set the projection. The Spatial Reference Properties dialogue appears:
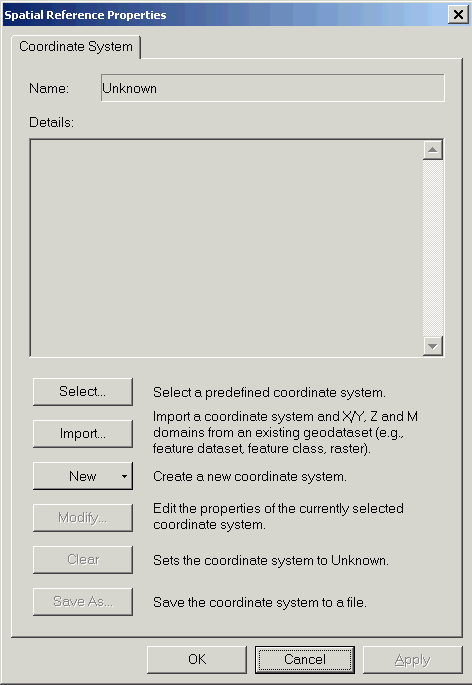
Click the Select button:
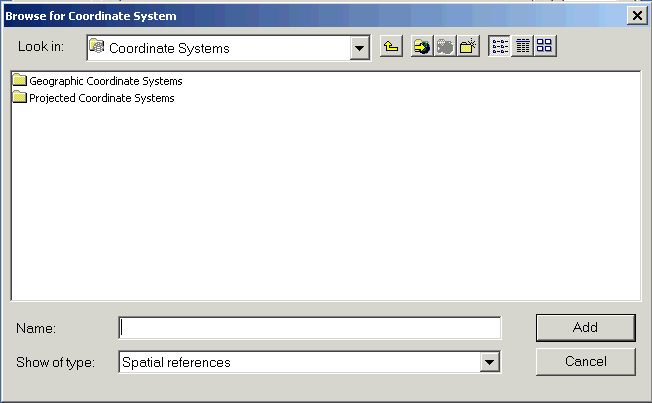
Choose an appropriate Coordinate System. Only you can know which one is correct for your data set. For the example data above, I’m just using simple Decimal Degree data with the WGS 84 datum.
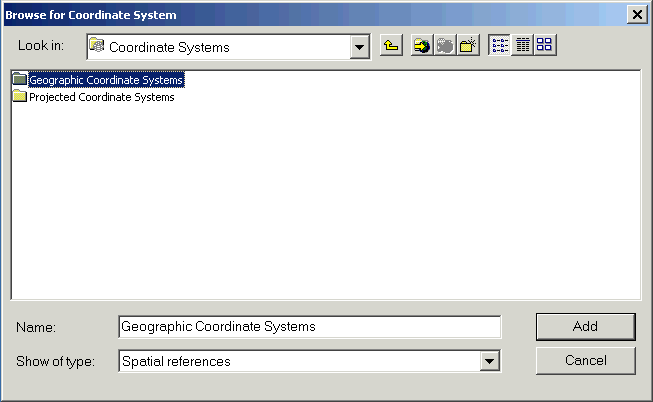
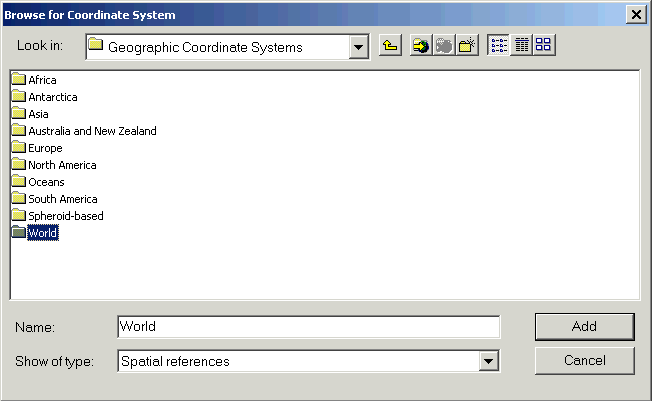
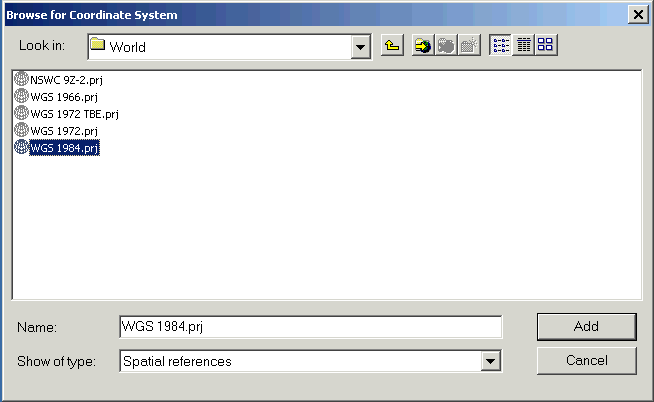
Once you’ve set a projection, click the OK button:
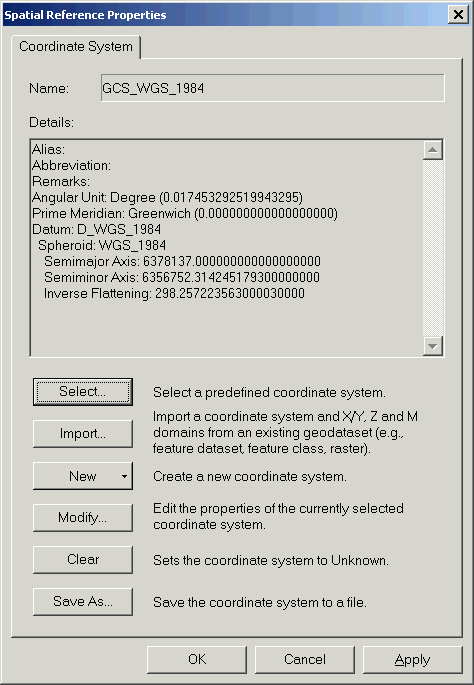
Click the OK button:
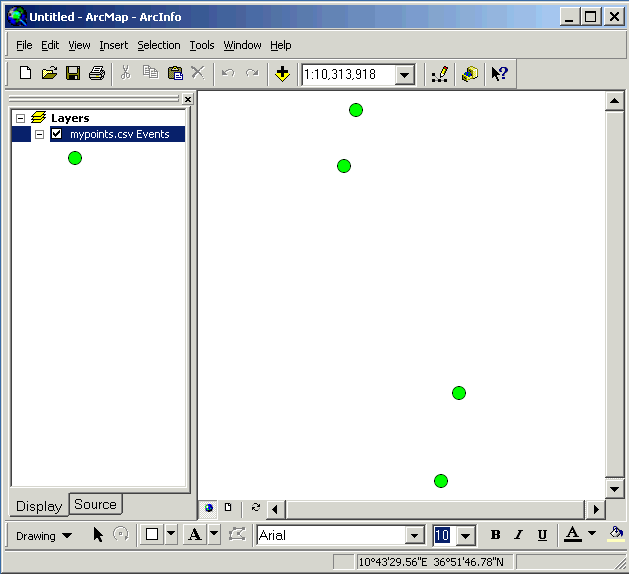
Your points appear in ArcMap. To avoid repetition of this process, and for other good reasons which temporarily escape me, it is a good idea to convert the imported CSV data set into a shapefile.
Right-click on the data set and choose Data then Export Data:
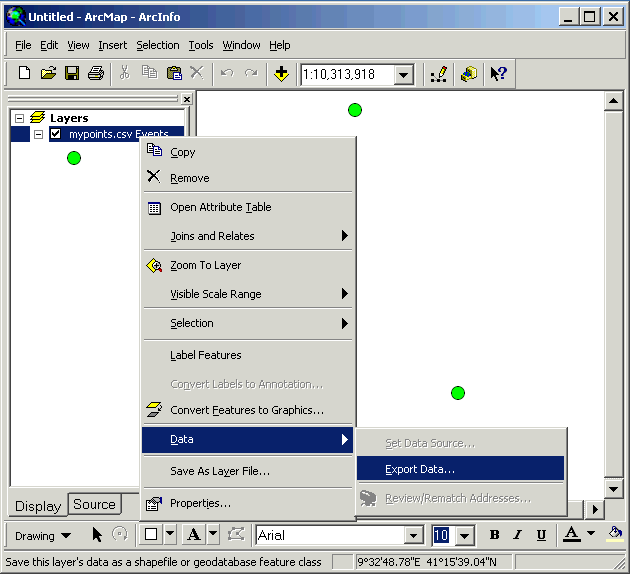
Change the output file name from Export_Output.shp to something meaningful, retaining the .shp extension and click OK:
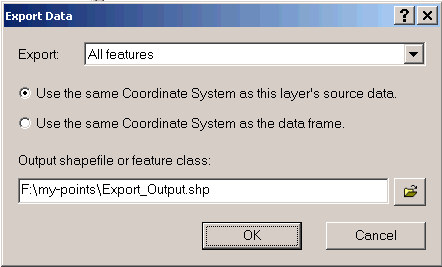
There will be some clicking and whirring and then you will be asked:

You may as well say yes. The picture below shows both data sets:
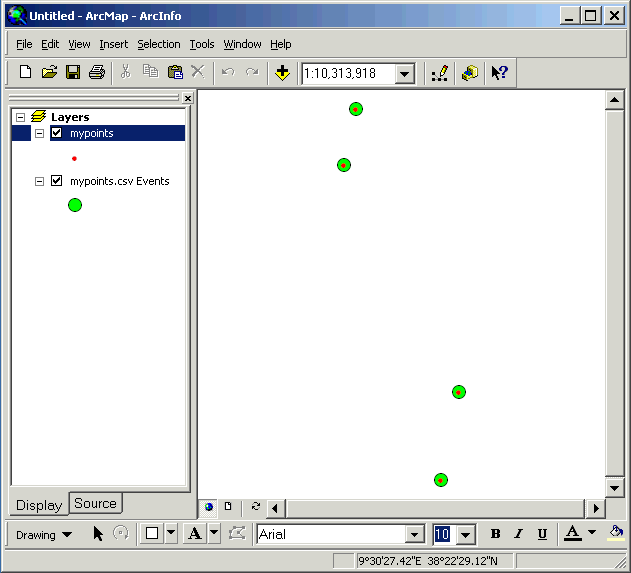
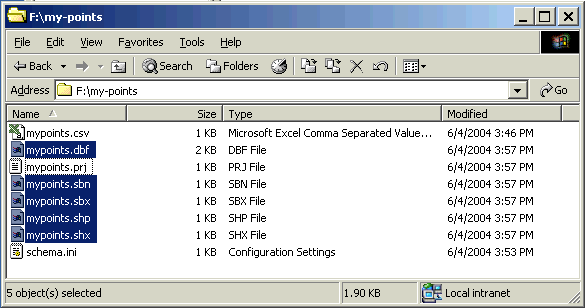
If you look in the directory containing the shapefile you have just created, you will see the five files that actaully constitute a so-called shapefile. Interesting, eh? But worth bearing in mind. The .prj file is optional: It contains projection information. If it is present you need to copy it along with the other files constituting the Shapefile.
Here endeth the lesson. You can find more ArcGIS-related entertainment here.
